|
cf4ocl (C Framework for OpenCL)
v2.1.0
Object-oriented framework for developing and benchmarking OpenCL projects in C/C++
|
|
cf4ocl (C Framework for OpenCL)
v2.1.0
Object-oriented framework for developing and benchmarking OpenCL projects in C/C++
|
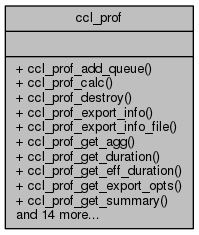
Profile class, contains profiling information of OpenCL queues and events. More...

Public Member Functions | |
| void | ccl_prof_add_queue (CCLProf *prof, const char *cq_name, CCLQueue *cq) |
| Add a command queue wrapper for profiling. More... | |
| cl_bool | ccl_prof_calc (CCLProf *prof, CCLErr **err) |
| Determine aggregate statistics for the given profile object. More... | |
| void | ccl_prof_destroy (CCLProf *prof) |
| Destroy a profile object. More... | |
| cl_bool | ccl_prof_export_info (CCLProf *prof, FILE *stream, CCLErr **err) |
| Export event profiling information to a given stream. More... | |
| cl_bool | ccl_prof_export_info_file (CCLProf *prof, const char *filename, CCLErr **err) |
| Helper function which exports profiling info to a given file, automatically opening and closing the file. More... | |
| const CCLProfAgg * | ccl_prof_get_agg (CCLProf *prof, const char *event_name) |
| Return aggregate statistics for events with the given name. More... | |
| cl_ulong | ccl_prof_get_duration (CCLProf *prof) |
| Get duration of all events in nanoseconds. More... | |
| cl_ulong | ccl_prof_get_eff_duration (CCLProf *prof) |
| Get effective duration of all events in nanoseconds, i.e. More... | |
| CCLProfExportOptions | ccl_prof_get_export_opts () |
| Get current export options. More... | |
| const char * | ccl_prof_get_summary (CCLProf *prof, int agg_sort, int ovlp_sort) |
| Get a summary with the profiling info. More... | |
| void | ccl_prof_iter_agg_init (CCLProf *prof, int sort) |
| Initialize an iterator for profiled aggregate event instances. More... | |
| const CCLProfAgg * | ccl_prof_iter_agg_next (CCLProf *prof) |
| Return the next aggregate statistic instance. More... | |
| void | ccl_prof_iter_info_init (CCLProf *prof, int sort) |
| Initialize an iterator for event profiling info instances. More... | |
| const CCLProfInfo * | ccl_prof_iter_info_next (CCLProf *prof) |
| Return the next event profiling info instance. More... | |
| void | ccl_prof_iter_inst_init (CCLProf *prof, int sort) |
| Initialize an iterator for event instant instances. More... | |
| const CCLProfInst * | ccl_prof_iter_inst_next (CCLProf *prof) |
| Return the next event instant instance. More... | |
| void | ccl_prof_iter_overlap_init (CCLProf *prof, int sort) |
| Initialize an iterator for overlap instances. More... | |
| const CCLProfOverlap * | ccl_prof_iter_overlap_next (CCLProf *prof) |
| Return the next overlap instance. More... | |
| CCLProf * | ccl_prof_new () |
| Create a new profile object. More... | |
| void | ccl_prof_print_summary (CCLProf *prof) |
| Print a summary of the profiling info. More... | |
| void | ccl_prof_set_export_opts (CCLProfExportOptions export_opts) |
| Set export options using a CCLProfExportOptions struct. More... | |
| void | ccl_prof_start (CCLProf *prof) |
| Starts the global profiler timer. More... | |
| void | ccl_prof_stop (CCLProf *prof) |
| Stops the global profiler timer. More... | |
| double | ccl_prof_time_elapsed (CCLProf *prof) |
| If profiling has started but not stopped, returns the time since the profiling started. More... | |
Profile class, contains profiling information of OpenCL queues and events.
Definition at line 91 of file ccl_profiler.c.