|
cf4ocl (C Framework for OpenCL)
v2.1.0
Object-oriented framework for developing and benchmarking OpenCL projects in C/C++
|
|
cf4ocl (C Framework for OpenCL)
v2.1.0
Object-oriented framework for developing and benchmarking OpenCL projects in C/C++
|
The profiler module provides classes and methods for profiling wrapped OpenCL events and queues. More...
Data Structures | |
| struct | ccl_prof_agg |
| Aggregate event info. More... | |
| struct | ccl_prof_export_options |
| Export options. More... | |
| struct | ccl_prof_info |
| Event profiling info. More... | |
| struct | ccl_prof_inst |
| Event instant. More... | |
| struct | ccl_prof_overlap |
| Representation of an overlap of events. More... | |
Typedefs | |
| typedef struct ccl_prof | CCLProf |
| Profile class, contains profiling information of OpenCL queues and events. More... | |
| typedef struct ccl_prof | CCLProf |
| Profile class, contains profiling information of OpenCL queues and events. More... | |
| typedef struct ccl_prof_agg | CCLProfAgg |
| Aggregate event info. | |
| typedef struct ccl_prof_agg | CCLProfAgg |
| Aggregate event info. | |
|
typedef struct ccl_prof_export_options | CCLProfExportOptions |
| Export options. | |
|
typedef struct ccl_prof_export_options | CCLProfExportOptions |
| Export options. | |
| typedef struct ccl_prof_info | CCLProfInfo |
| Event profiling info. | |
| typedef struct ccl_prof_info | CCLProfInfo |
| Event profiling info. | |
| typedef struct ccl_prof_inst | CCLProfInst |
| Event instant. | |
| typedef struct ccl_prof_inst | CCLProfInst |
| Event instant. | |
| typedef struct ccl_prof_overlap | CCLProfOverlap |
| Representation of an overlap of events. | |
| typedef struct ccl_prof_overlap | CCLProfOverlap |
| Representation of an overlap of events. | |
Functions | |
| void | ccl_prof_add_queue (CCLProf *prof, const char *cq_name, CCLQueue *cq) |
| Add a command queue wrapper for profiling. More... | |
| cl_bool | ccl_prof_calc (CCLProf *prof, CCLErr **err) |
| Determine aggregate statistics for the given profile object. More... | |
| void | ccl_prof_destroy (CCLProf *prof) |
| Destroy a profile object. More... | |
| cl_bool | ccl_prof_export_info (CCLProf *prof, FILE *stream, CCLErr **err) |
| Export event profiling information to a given stream. More... | |
| cl_bool | ccl_prof_export_info_file (CCLProf *prof, const char *filename, CCLErr **err) |
| Helper function which exports profiling info to a given file, automatically opening and closing the file. More... | |
| const CCLProfAgg * | ccl_prof_get_agg (CCLProf *prof, const char *event_name) |
| Return aggregate statistics for events with the given name. More... | |
| cl_ulong | ccl_prof_get_duration (CCLProf *prof) |
| Get duration of all events in nanoseconds. More... | |
| cl_ulong | ccl_prof_get_eff_duration (CCLProf *prof) |
| Get effective duration of all events in nanoseconds, i.e. More... | |
| CCLProfExportOptions | ccl_prof_get_export_opts () |
| Get current export options. More... | |
| const char * | ccl_prof_get_summary (CCLProf *prof, int agg_sort, int ovlp_sort) |
| Get a summary with the profiling info. More... | |
| void | ccl_prof_iter_agg_init (CCLProf *prof, int sort) |
| Initialize an iterator for profiled aggregate event instances. More... | |
| const CCLProfAgg * | ccl_prof_iter_agg_next (CCLProf *prof) |
| Return the next aggregate statistic instance. More... | |
| void | ccl_prof_iter_info_init (CCLProf *prof, int sort) |
| Initialize an iterator for event profiling info instances. More... | |
| const CCLProfInfo * | ccl_prof_iter_info_next (CCLProf *prof) |
| Return the next event profiling info instance. More... | |
| void | ccl_prof_iter_inst_init (CCLProf *prof, int sort) |
| Initialize an iterator for event instant instances. More... | |
| const CCLProfInst * | ccl_prof_iter_inst_next (CCLProf *prof) |
| Return the next event instant instance. More... | |
| void | ccl_prof_iter_overlap_init (CCLProf *prof, int sort) |
| Initialize an iterator for overlap instances. More... | |
| const CCLProfOverlap * | ccl_prof_iter_overlap_next (CCLProf *prof) |
| Return the next overlap instance. More... | |
| CCLProf * | ccl_prof_new () |
| Create a new profile object. More... | |
| void | ccl_prof_print_summary (CCLProf *prof) |
| Print a summary of the profiling info. More... | |
| void | ccl_prof_set_export_opts (CCLProfExportOptions export_opts) |
| Set export options using a CCLProfExportOptions struct. More... | |
| void | ccl_prof_start (CCLProf *prof) |
| Starts the global profiler timer. More... | |
| void | ccl_prof_stop (CCLProf *prof) |
| Stops the global profiler timer. More... | |
| double | ccl_prof_time_elapsed (CCLProf *prof) |
| If profiling has started but not stopped, returns the time since the profiling started. More... | |
The profiler module provides classes and methods for profiling wrapped OpenCL events and queues.
The profiling module offers two methods for obtaining information about the performed computations:
ccl_prof_*_summary() functions.In order to use the first method, the CL_QUEUE_PROFILING_ENABLE property should be specified when creating command queue wrappers with ccl_queue_new() or ccl_queue_new_full().
After all the computations and memory transfers take place, the utilized queue wrappers are passed to the profiler using the ccl_prof_add_queue() function. The ccl_prof_calc() function can then be called to perform the required analysis.
At this stage, different types of profiling information become available, and can be iterated over:
While this information can be subject to different types of examination by client code, the profiler module also offers some functionality which allows for a more immediate interpretation of results:
Example: Conway's game of life using double-buffered images (complete example)
The output of ccl_prof_print_summary() will be something like:
   Aggregate times by event  :
     ------------------------------------------------------------------
     | Event name                     | Rel. time (%) | Abs. time (s) |
     ------------------------------------------------------------------
     | NDRANGE_KERNEL                 |       97.2742 |    3.7468e-02 |
     | READ_IMAGE                     |        2.6747 |    1.0303e-03 |
     | WRITE_IMAGE                    |        0.0511 |    1.9690e-05 |
     ------------------------------------------------------------------
                                      |         Total |    3.8518e-02 |
                                      ---------------------------------
   Event overlaps            :
     ------------------------------------------------------------------
     | Event 1                | Event2                 | Overlap (s)  |
     ------------------------------------------------------------------
     | READ_IMAGE             | NDRANGE_KERNEL         |   1.3618e-04 |
     ------------------------------------------------------------------
                              |                  Total |   1.3618e-04 |
                              -----------------------------------------
   Tot. of all events (eff.) : 3.838198e-02s
   Total ellapsed time       : 4.295200e-02s
   Time spent in device      : 89.36%
   Time spent in host        : 10.64%
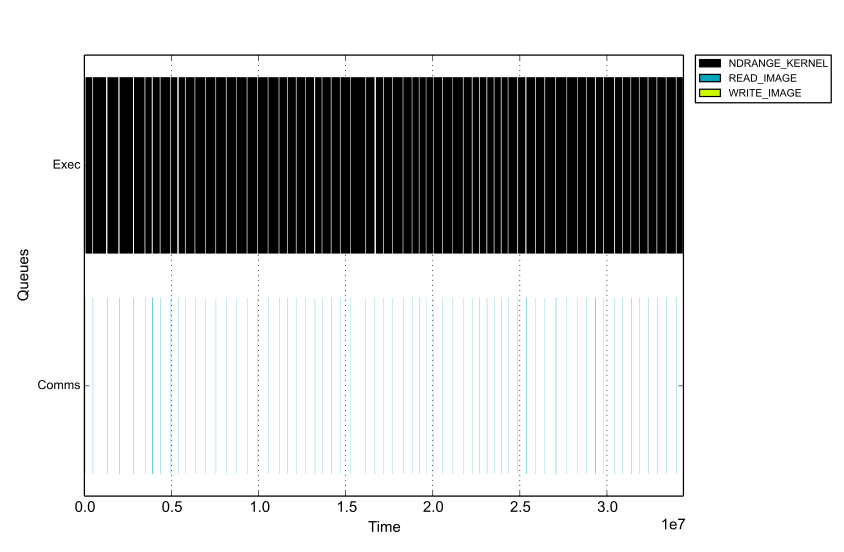
Instead of the default command-based event names such as NDRANGE_KERNEL, specific names can be set with the ccl_event_set_name() function. This allows to: (a) separate the aggregation of events of the same type (e.g., differentiate between the execution of two different kernels); and, (b) aggregate events of different types (e.g., aggregate reads and writes into a single "comms" event).
The ccl_plot_events script can be used to plot a Gantt-like chart of the events which took place in the queues. Running the following command...
$ python ccl_plot_events.py prof.tsv
...will produce the following image:
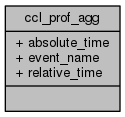
| struct ccl_prof_agg |
Aggregate event info.
Definition at line 226 of file ccl_profiler.h.
| Data Fields | ||
|---|---|---|
| cl_ulong | absolute_time | Total (absolute) time of events with name equal to CCLProfAgg::event_name. |
| const char * | event_name | Name of event which the instant refers to. |
| double | relative_time | Relative time of events with name equal to CCLProfAgg::event_name. |
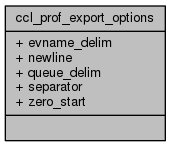
| struct ccl_prof_export_options |
Export options.
Definition at line 449 of file ccl_profiler.h.
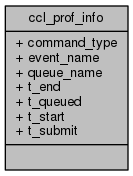
| struct ccl_prof_info |
Event profiling info.
Definition at line 267 of file ccl_profiler.h.
| struct ccl_prof_inst |
Event instant.
Definition at line 360 of file ccl_profiler.h.
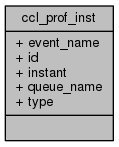
| Data Fields | ||
|---|---|---|
| const char * | event_name | Name of event which the instant refers to. |
| cl_uint | id | Event instant ID. |
| cl_ulong | instant | Event instant in nanoseconds from current device time counter. |
| const char * | queue_name | Name of command queue associated with event. |
| CCLProfInstType | type | Type of event instant (CCL_PROF_INST_TYPE_START or CCL_PROF_INST_TYPE_END). |
| struct ccl_prof_overlap |
Representation of an overlap of events.
Definition at line 411 of file ccl_profiler.h.
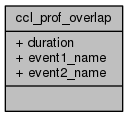
| Data Fields | ||
|---|---|---|
| cl_ulong | duration | Overlap duration in nanoseconds. |
| const char * | event1_name | Name of first overlapping event. |
| const char * | event2_name | Name of second overlapping event. |
Profile class, contains profiling information of OpenCL queues and events.
Definition at line 210 of file ccl_profiler.h.
Profile class, contains profiling information of OpenCL queues and events.
Definition at line 210 of file ccl_profiler.h.
| enum CCLProfAggSort |
Sort criteria for aggregate event info instances.
Definition at line 254 of file ccl_profiler.h.
| enum CCLProfAggSort |
Sort criteria for aggregate event info instances.
Definition at line 254 of file ccl_profiler.h.
| enum CCLProfInfoSort |
Sort criteria for event profiling info instances.
Definition at line 321 of file ccl_profiler.h.
| enum CCLProfInfoSort |
Sort criteria for event profiling info instances.
Definition at line 321 of file ccl_profiler.h.
| enum CCLProfInstSort |
Sort criteria for event instants (CCLProfInst).
Definition at line 398 of file ccl_profiler.h.
| enum CCLProfInstSort |
Sort criteria for event instants (CCLProfInst).
Definition at line 398 of file ccl_profiler.h.
| enum CCLProfInstType |
Type of event instant (CCLProfInst).
| Enumerator | |
|---|---|
| CCL_PROF_INST_TYPE_START |
Start event instant. |
| CCL_PROF_INST_TYPE_END |
End event instant. |
| CCL_PROF_INST_TYPE_START |
Start event instant. |
| CCL_PROF_INST_TYPE_END |
End event instant. |
Definition at line 347 of file ccl_profiler.h.
| enum CCLProfOverlapSort |
Sort criteria for overlaps (CCLProfOverlap).
Definition at line 436 of file ccl_profiler.h.
| enum CCLProfOverlapSort |
Sort criteria for overlaps (CCLProfOverlap).
Definition at line 436 of file ccl_profiler.h.
| enum CCLProfSortOrder |
Sort order for the profile module iterators.
| Enumerator | |
|---|---|
| CCL_PROF_SORT_ASC |
Sort ascending (default). |
| CCL_PROF_SORT_DESC |
Sort descending. |
| CCL_PROF_SORT_ASC |
Sort ascending (default). |
| CCL_PROF_SORT_DESC |
Sort descending. |
Definition at line 215 of file ccl_profiler.h.
Add a command queue wrapper for profiling.
| [in] | prof | A profile object. |
| [in] | cq_name | Command queue name. |
| [in] | cq | Command queue wrapper object. |
Definition at line 1234 of file ccl_profiler.c.
Determine aggregate statistics for the given profile object.
The command queues to be profiled will have their events garbage collected with ccl_queue_gc(). As such, they can be reused and re-added for profiling to a new profile object.
| [in] | prof | A profile object. |
| [out] | err | Return location for a CCLErr object, or NULL if error reporting is to be ignored. |
Definition at line 1280 of file ccl_profiler.c.
| void ccl_prof_destroy | ( | CCLProf * | prof | ) |
Destroy a profile object.
| [in] | prof | Profile object to destroy. |
Definition at line 1117 of file ccl_profiler.c.
Export event profiling information to a given stream.
Each line of the exported data will have the following format, ordered by event start time:
queue start-time end-time event-name
For example:
q0    100    120    load_data1
q1    100    132    load_data2
q0    121    159    process_data1
q1    133    145    process_data2
q0    146    157    read_result
Several export parameters can be configured with the ccl_prof_get_export_opts() and ccl_prof_set_export_opts() functions, by manipulating a CCLProfExportOptions struct.
| [in] | prof | Profile object. |
| [out] | stream | Stream where export info to. |
| [out] | err | Return location for a CCLErr object, or NULL if error reporting is to be ignored. |
Definition at line 1845 of file ccl_profiler.c.
Helper function which exports profiling info to a given file, automatically opening and closing the file.
See the ccl_prof_export_info() for more information.
| [in] | prof | Profile object. |
| [in] | filename | Name of file where information will be saved to. |
| [out] | err | Return location for a CCLErr object, or NULL if error reporting is to be ignored. |
Definition at line 1931 of file ccl_profiler.c.
| const CCLProfAgg * ccl_prof_get_agg | ( | CCLProf * | prof, |
| const char * | event_name | ||
| ) |
Return aggregate statistics for events with the given name.
| [in] | prof | Profile object. |
| [in] | event_name | Event name. |
Definition at line 1352 of file ccl_profiler.c.
| cl_ulong ccl_prof_get_duration | ( | CCLProf * | prof | ) |
Get duration of all events in nanoseconds.
| [in] | prof | Profile object. |
Definition at line 1624 of file ccl_profiler.c.
| cl_ulong ccl_prof_get_eff_duration | ( | CCLProf * | prof | ) |
Get effective duration of all events in nanoseconds, i.e.
the duration of all events minus event overlaps.
If no overlaps occur, this function will return the same value as ccl_prof_get_duration().
| [in] | prof | Profile object. |
Definition at line 1650 of file ccl_profiler.c.
| CCLProfExportOptions ccl_prof_get_export_opts | ( | ) |
Get current export options.
Definition at line 1999 of file ccl_profiler.c.
| const char * ccl_prof_get_summary | ( | CCLProf * | prof, |
| int | agg_sort, | ||
| int | ovlp_sort | ||
| ) |
Get a summary with the profiling info.
More specifically, this function returns a string containing a table of aggregate event statistics and a table of event overlaps. The order of the returned information can be specified in the function arguments.
| [in] | prof | Profile object. |
| [in] | agg_sort | Sorting performed on aggregate statistics (bitfield of CCLProfAggSort ORed with CCLProfSortOrder). |
| [in] | ovlp_sort | Sorting performed on event overlaps (bitfield of CCLProfOverlapSort ORed with CCLProfSortOrder). |
Definition at line 1711 of file ccl_profiler.c.
| void ccl_prof_iter_agg_init | ( | CCLProf * | prof, |
| int | sort | ||
| ) |
Initialize an iterator for profiled aggregate event instances.
| [in] | prof | Profile object. |
| [in] | sort | Bitfield of CCLProfAggSort OR CCLProfSortOrder, for example CCL_PROF_AGG_SORT_NAME | CCL_PROF_SORT_DESC. |
Definition at line 1390 of file ccl_profiler.c.
| const CCLProfAgg * ccl_prof_iter_agg_next | ( | CCLProf * | prof | ) |
Return the next aggregate statistic instance.
| [in] | prof | Profile object. |
Definition at line 1415 of file ccl_profiler.c.
| void ccl_prof_iter_info_init | ( | CCLProf * | prof, |
| int | sort | ||
| ) |
Initialize an iterator for event profiling info instances.
| [in] | prof | Profile object. |
| [in] | sort | Bitfield of CCLProfInfoSort OR CCLProfSortOrder, for example CCL_PROF_INFO_SORT_T_START | CCL_PROF_SORT_ASC. |
Definition at line 1449 of file ccl_profiler.c.
| const CCLProfInfo * ccl_prof_iter_info_next | ( | CCLProf * | prof | ) |
Return the next event profiling info instance.
| [in] | prof | Profile object. |
Definition at line 1473 of file ccl_profiler.c.
| void ccl_prof_iter_inst_init | ( | CCLProf * | prof, |
| int | sort | ||
| ) |
Initialize an iterator for event instant instances.
| [in] | prof | Profile object. |
| [in] | sort | Bitfield of CCLProfInstSort OR CCLProfSortOrder, for example CCL_PROF_INST_SORT_INSTANT | CCL_PROF_SORT_ASC. |
Definition at line 1507 of file ccl_profiler.c.
| const CCLProfInst * ccl_prof_iter_inst_next | ( | CCLProf * | prof | ) |
Return the next event instant instance.
| [in] | prof | Profile object. |
Definition at line 1532 of file ccl_profiler.c.
| void ccl_prof_iter_overlap_init | ( | CCLProf * | prof, |
| int | sort | ||
| ) |
Initialize an iterator for overlap instances.
| [in] | prof | Profile object. |
| [in] | sort | Bitfield of CCLProfOverlapSort OR CCLProfSortOrder, for example CCL_PROF_OVERLAP_SORT_DURATION | CCL_PROF_SORT_DESC. |
Definition at line 1567 of file ccl_profiler.c.
| const CCLProfOverlap * ccl_prof_iter_overlap_next | ( | CCLProf * | prof | ) |
Return the next overlap instance.
| [in] | prof | Profile object. |
Definition at line 1591 of file ccl_profiler.c.
| CCLProf * ccl_prof_new | ( | ) |
Create a new profile object.
Definition at line 1096 of file ccl_profiler.c.
| void ccl_prof_print_summary | ( | CCLProf * | prof | ) |
Print a summary of the profiling info.
More specifically, this function prints a table of aggregate event statistics (sorted by absolute time), and a table of event overlaps (sorted by overlap duration).
For more control of where and how this summary is printed, use the ccl_prof_get_summary() function.
| [in] | prof | Profile object. |
Definition at line 1675 of file ccl_profiler.c.
| void ccl_prof_set_export_opts | ( | CCLProfExportOptions | export_opts | ) |
Set export options using a CCLProfExportOptions struct.
| [in] | export_opts | Export options to set. |
Definition at line 1987 of file ccl_profiler.c.
| void ccl_prof_start | ( | CCLProf * | prof | ) |
Starts the global profiler timer.
Only required if client wishes to compare the effectively ellapsed time with the OpenCL kernels time.
| [in] | prof | A profile object. |
Definition at line 1177 of file ccl_profiler.c.
| void ccl_prof_stop | ( | CCLProf * | prof | ) |
Stops the global profiler timer.
Only required if ccl_prof_start() was called.
| [in] | prof | A profile object. |
Definition at line 1195 of file ccl_profiler.c.
| double ccl_prof_time_elapsed | ( | CCLProf * | prof | ) |
If profiling has started but not stopped, returns the time since the profiling started.
If profiling has been stopped, returns the elapsed time between the time it started and the time it stopped.
| [in] | prof | A profile object. |
Definition at line 1215 of file ccl_profiler.c.
 1.8.7
1.8.7 
